signal strength 1 of 5
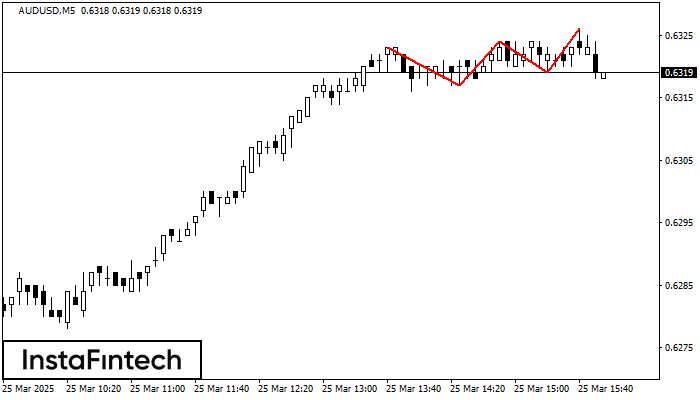
The Triple Top pattern has formed on the chart of the AUDUSD M5. Features of the pattern: borders have an ascending angle; the lower line of the pattern has the coordinates 0.6317/0.6319 with the upper limit 0.6323/0.6326; the projection of the width is 6 points. The formation of the Triple Top figure most likely indicates a change in the trend from upward to downward. This means that in the event of a breakdown of the support level of 0.6317, the price is most likely to continue the downward movement.
The M5 and M15 time frames may have more false entry points.
আরও দেখুন
- All
- Double Top
- Flag
- Head and Shoulders
- Pennant
- Rectangle
- Triangle
- Triple top
- All
- #AAPL
- #AMZN
- #Bitcoin
- #EBAY
- #FB
- #GOOG
- #INTC
- #KO
- #MA
- #MCD
- #MSFT
- #NTDOY
- #PEP
- #TSLA
- #TWTR
- AUDCAD
- AUDCHF
- AUDJPY
- AUDUSD
- EURCAD
- EURCHF
- EURGBP
- EURJPY
- EURNZD
- EURRUB
- EURUSD
- GBPAUD
- GBPCHF
- GBPJPY
- GBPUSD
- GOLD
- NZDCAD
- NZDCHF
- NZDJPY
- NZDUSD
- SILVER
- USDCAD
- USDCHF
- USDJPY
- USDRUB
- All
- M5
- M15
- M30
- H1
- D1
- All
- Buy
- Sale
- All
- 1
- 2
- 3
- 4
- 5
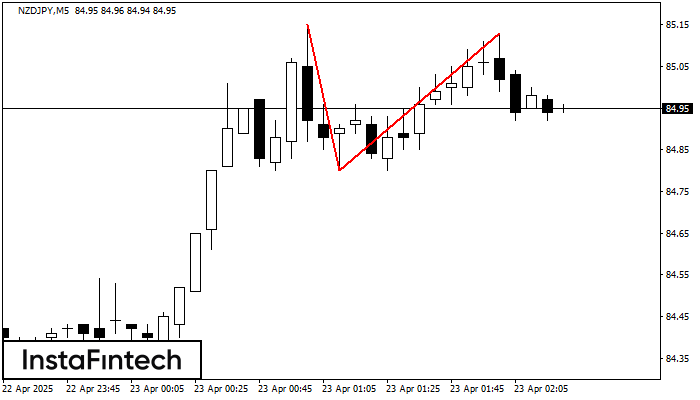
NZDJPY M5 पर डबल टॉप रीवर्सल पैटर्न बना है। विशेषताएं: ऊपरी सीमा 85.15; निचली सीमा 84.80; पैटर्न की चौड़ाई 33 पॉइंट्स है। सेल ट्रेडों को 84.80 की निचली सीमा के
M5 और M15 समय सीमा में अधिक फाल्स एंट्री पॉइंट्स हो सकते हैं।
Open chart in a new window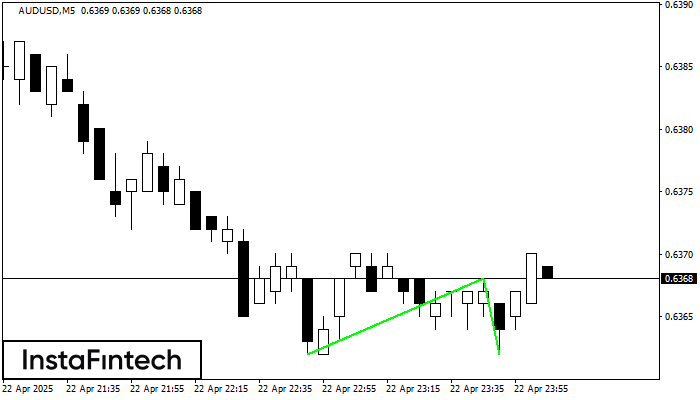
डबल बॉटम पैटर्न AUDUSD M5 पर बना है; ऊपरी सीमा 0.6368 है; निचली सीमा 0.6362 है। पैटर्न की चौड़ाई 6 अंक है। ऊपरी सीमा 0.6368 के टूटने के मामले में
M5 और M15 समय सीमा में अधिक फाल्स एंट्री पॉइंट्स हो सकते हैं।
Open chart in a new window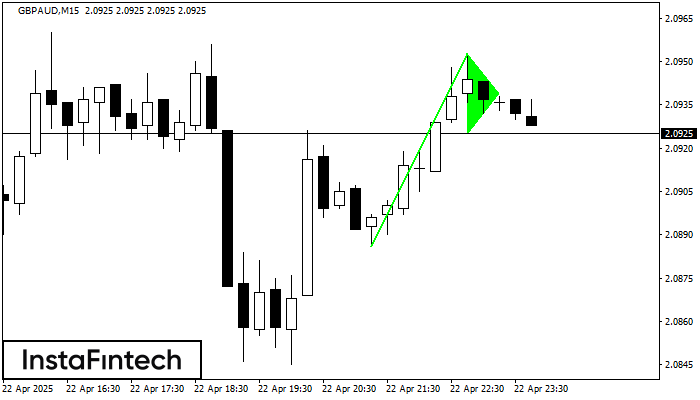
बुलिश पताका सिग्नल - ट्रेडिंग इंस्ट्रूमेंट GBPAUD M15, निरंतरता पैटर्न। पूर्वानुमान: पैटर्न के उच्च 2.0953 के ऊपर एक खरीद स्थिति सेट करना संभव है, इसके साथ अगला कदम फ्लैगपोल ऊंचाई
M5 और M15 समय सीमा में अधिक फाल्स एंट्री पॉइंट्स हो सकते हैं।
Open chart in a new window