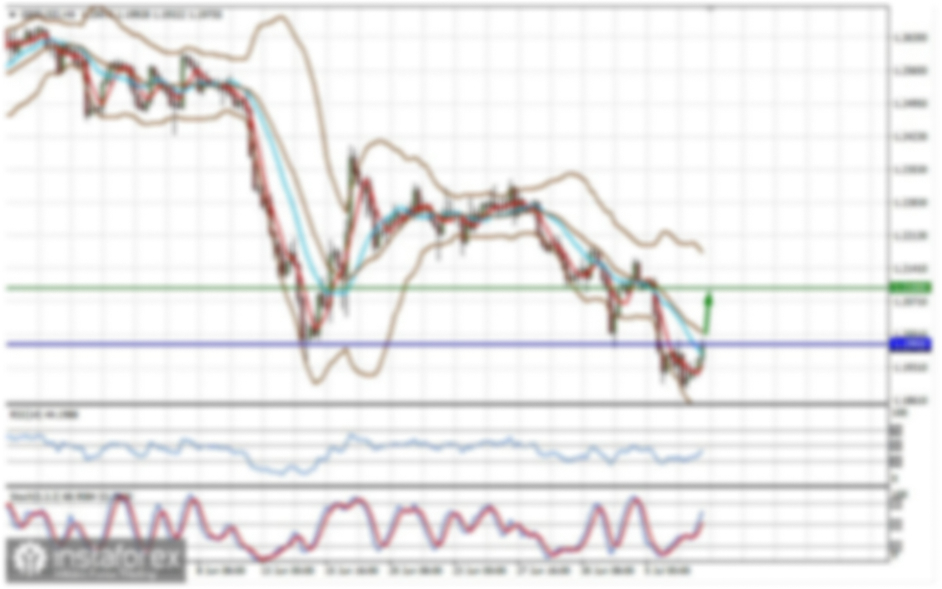
EUR/USD
Analysis: The ongoing upward trend of the EUR/USD pair has been developing since April of this year. The latest segment, which began in mid-July, is a counter-corrective wave of a complex form that has not yet completed. As of the analysis, conditions are forming for a final downward push within this wave.
Forecast: At the beginning of the upcoming week, a sideways movement of the euro is most likely, along the predicted resistance levels. There might be brief pressure on the upper boundary of the zone. Increased volatility and a reversal are possible towards the weekend, potentially coinciding with the release of important economic data.
Potential Reversal Zones:
- Resistance: 1.0990/1.1040
- Support: 1.0770/1.0720
Recommendations:
- Sell orders: Selling should be initiated after buy signals appear near the calculated support area. However, note the limited potential for the upcoming decline.
- Purchases: Such trades are riskier in the coming days.
USD/JPY
Analysis: The USD/JPY chart shows a trend shift. The ongoing movement, which began on August 5, has a wave level surpassing the previous bearish trend correction. The price has broken through the upper boundary of the intermediate resistance. Before continuing its rise, the price needs to consolidate at the current level.
Forecast: A sideways movement along the support boundaries is expected at the beginning of the upcoming week. A reversal and the start of an active price movement phase are anticipated afterward. During a trend change, short-term volatility is possible, including a brief breach of the lower support boundary.
Potential Reversal Zones:
- Resistance: 151.70/152.20
- Support: 146.20/145.70
Recommendations:
- Sell orders: No selling conditions exist in the Japanese yen market.
- Purchases: Buying opportunities have potential. It is safest to monitor buy signals in the support area.
GBP/JPY
Analysis: The short-term trend that has been ongoing for the past month in the GBP/JPY pair has ended. From the lower boundary of a strong reversal zone on a larger time frame, the price formed a counter-wave starting on August 5 with a high wave level. After the formation of a correction, this segment will initiate a new upward trend wave.
Forecast: A sideways movement with potential for a reversal is expected at the start of the upcoming week. Afterward, the pair's rate is likely to resume its growth. This timing might coincide with the release of significant economic news.
Potential Reversal Zones:
- Resistance: 193.30/193.80
- Support: 187.00/186.50
Recommendations:
- Sell orders: No selling conditions exist in the pair's market.
- Purchases: There is good potential for deposit growth. Enter trades by monitoring signals in the support zone.
USD/CAD
Analysis: Since September last year, USD/CAD quotes have been drifting within a broad sideways channel. The current segment, which began on August 5, has a downward vector. The quotes have reached an intermediate resistance zone. The potential of the downward segment from August 8 holds reversal potential.
Forecast: In the next couple of days, the price is highly likely to continue declining and moving sideways along the support zone. The second half of the week is expected to see increased price volatility. After possible pressure on the lower boundary of the zone, a direction change and price growth up to the resistance boundaries can be expected.
Potential Reversal Zones:
- Resistance: 1.3880/1.3930
- Support: 1.3690/1.3640
Recommendations:
- Purchases: Will be relevant after corresponding signals appear in the support area according to your trading system.
- Sell orders: Have limited potential, so reduce the lot size as much as possible.
NZD/USD
Analysis: Since December last year, the NZD/USD pair has been trending downward, forming a correction on a larger scale. The final part of the current corrective wave is still missing. The quotes have formed a flat price channel, currently heading towards its upper boundary. The lower edge of the channel coincides with the upper boundary of the preliminary target zone.
Forecast: In the coming week, the rise is expected to end, a reversal to form, and a resumption of the decline until the current wave completes near the support zone. Brief price pressure on the upper resistance boundary cannot be ruled out in the early days.
Potential Reversal Zones:
- Resistance: 0.6040/0.6090
- Support: 0.5860/0.5810
Recommendations:
- Purchases: Are high-risk and potentially unprofitable.
- Sell orders: Can be used after reversal signals appear in your trading systems.
Gold
Analysis: On the weekly scale, gold has been forming a horizontal downward correction since April this year. The last part (C) of the wave remains incomplete. Over the past month, the price has formed a horizontal channel. In recent days, quotes have been retracing upward.
Forecast: In the coming week, a continuation of the overall sideways movement is expected. In the early days, the upward vector is more likely. Its completion can be expected near the resistance zone. The price is then likely to drift sideways, forming conditions for a resumption of the decline. The downward movement can be expected at the end of the week or in the following days.
Potential Reversal Zones:
- Resistance: 2470.0/2490.0
- Support: 2360.0/2340.0
Recommendations:
- Purchases: Have limited growth potential due to resistance. It is safer to reduce the volume size in trades.
- Sell orders: Can be used with a fractional volume after confirmed reversal signals appear near the resistance zone.
Bitcoin
Analysis: The downward trend has brought Bitcoin quotes into the area of a strong potential reversal zone on a large timeframe. For the past month, the price of the coin has been retracing upward from the upper boundary, forming an upward segment with reversal potential. Intermediate support has formed the lower boundary of the expected weekly price range.
Forecast: In the coming week, a continuation of the overall sideways movement of this cryptocurrency is expected. In the next few days, a downward vector is more likely, with quotes declining to support levels. In this zone, a sideways transition can be expected, forming conditions for a resumption of price growth.
Potential Reversal Zones:
- Resistance: 64300.0/64800.0
- Support: 59100.0/58600.0
Recommendations:
- Sell orders: Will only be possible within individual trading sessions with a fractional volume.
- Purchases: Are not relevant until confirmed reversal signals appear in the support area.
Explanations: In simplified wave analysis (SWA), all waves consist of 3 parts (A-B-C). The analysis focuses on the last, unfinished wave on each timeframe. Expected movements are shown with dashed lines.
Attention: The wave algorithm does not take into account the duration of the movements of the instruments in time!