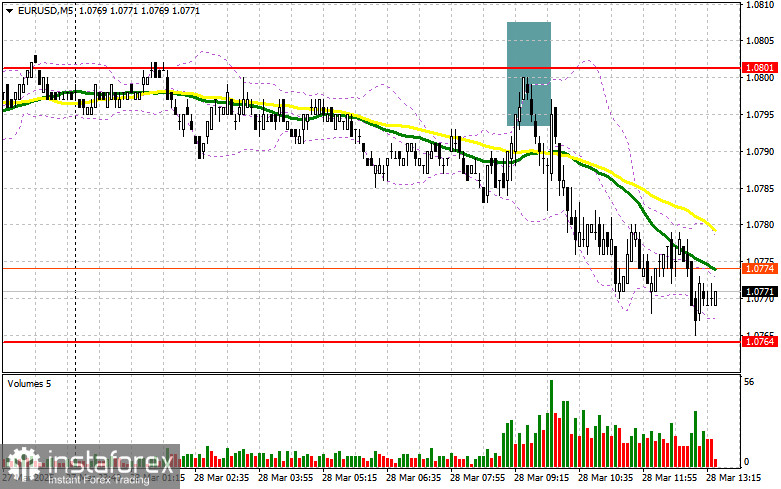
In my morning forecast, I highlighted the level of 1.0801 and planned to base my market entries on it. Let's look at the 5-minute chart to see what happened. A rise and false breakout around 1.0801 provided an opportunity to enter short positions, which resulted in the pair dropping over 35 points to the target level of 1.0764. The technical picture was not revised for the second half of the day.
To open long positions on EUR/USD:
Data from Germany and the labor market disappointed traders, reducing the appeal of the euro and pushing it lower against the U.S. dollar in the first half of the day. However, things could change in the second half as key U.S. inflation indicators are released. These include the core personal consumption expenditures (PCE) index, changes in consumer spending, and changes in personal income. Inflation expectations from the University of Michigan and speeches from FOMC members will wrap up the week. If the euro declines, only a false breakout around the support level of 1.0764 would serve as a signal to buy EUR/USD, aiming for a bullish reversal with a potential return to 1.0798, the resistance formed earlier today. A breakout and retest of this range from above would confirm a correct entry point for further growth toward 1.0830. The ultimate target will be 1.0863, where I plan to take profit. If EUR/USD drops and there is no buying activity around 1.0764—which is more likely—the pair could extend its correction. In that case, sellers may push it to 1.0736. Only after a false breakout there will I consider buying euros. I plan to open long positions from a rebound at 1.0691, targeting an intraday correction of 30–35 points.
To open short positions on EUR/USD:
Sellers made their presence known around key resistance, which could lead to a larger sell-off by the end of the week and a return to weekly lows. This would require strong U.S. statistics. In case of a negative market reaction, only a false breakout around 1.0798 would provide an entry point for short positions targeting a drop to support at 1.0764. A breakout and consolidation below this range would offer another suitable sell signal, aiming for 1.0736. The final target will be 1.0691, where I will take profit. If EUR/USD rises in the second half of the day and bears fail to act around 1.0798, buyers could push the pair higher. In that case, I will delay short entries until a test of the next resistance at 1.0830, where I will sell only after a failed breakout. If no downward movement occurs there either, I will look for short entries on a rebound from 1.0863, aiming for a 30–35 point correction.
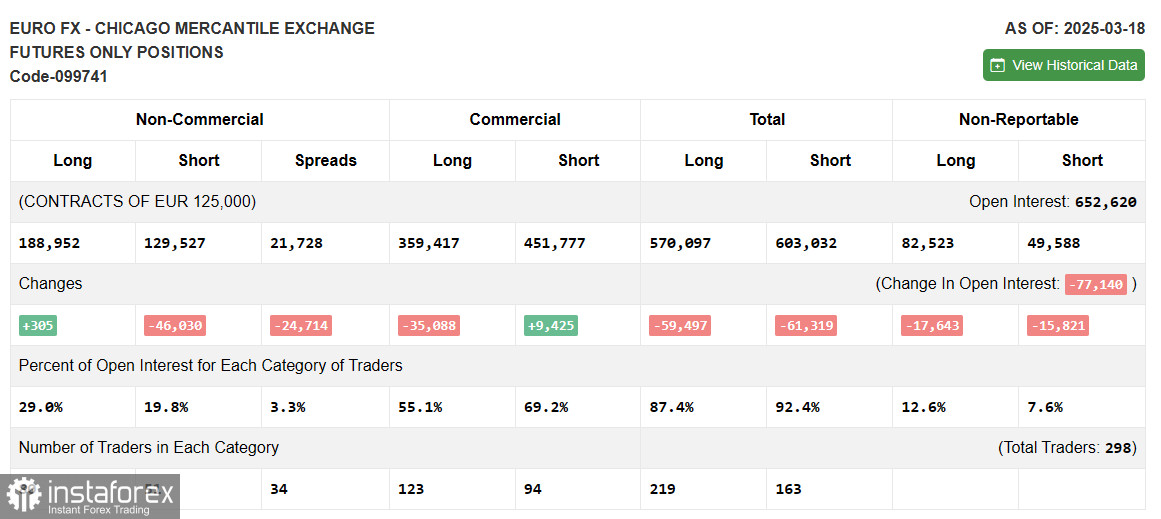
COT Report (Commitment of Traders) for March 18:
The report showed an increase in long positions and a sharp decline in short ones. More traders are willing to buy euros, while sellers continue to exit the market. The European Central Bank's cautious stance on rate cuts and weak U.S. fundamentals forcing the Federal Reserve to pivot to a more dovish monetary policy are driving the shift in market sentiment. The COT report indicates that non-commercial long positions rose by 305 to 188,952, while short positions dropped by 46,030 to 129,527. As a result, the net long position widened by 24,714.
Indicator signals:
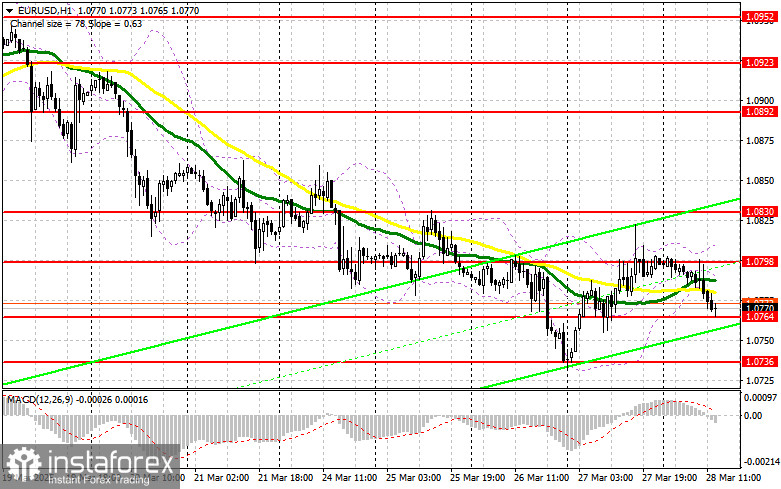
Moving Averages: Trading is taking place near the 30- and 50-day moving averages, indicating a sideways market.
Note: The author uses H1 hourly chart settings, which differ from the classical daily moving averages on the D1 chart.
Bollinger Bands: In the event of a decline, the lower band around 1.0765 will serve as support.
Indicator Descriptions:
• Moving average: identifies the current trend by smoothing out volatility and noise (Period – 50; marked in yellow on the chart).
• Moving average: identifies the current trend by smoothing out volatility and noise (Period – 30; marked in green).
• MACD (Moving Average Convergence/Divergence): Fast EMA – 12, Slow EMA – 26, SMA – 9.
• Bollinger Bands: Period – 20.
• Non-commercial traders: speculators such as individual traders, hedge funds, and large institutions using the futures market for speculative purposes under specific criteria.
• Long non-commercial positions: total long open positions held by non-commercial traders.
• Short non-commercial positions: total short open positions held by non-commercial traders.
• Total non-commercial net position: the difference between short and long positions held by non-commercial traders.