

signal strength 1 of 5

The Double Bottom pattern has been formed on #Bitcoin M5. Characteristics: the support level 83931.70; the resistance level 84051.13; the width of the pattern 11943 points. If the resistance level is broken, a change in the trend can be predicted with the first target point lying at the distance of 10667 points.
The M5 and M15 time frames may have more false entry points.
- All
- Double Top
- Flag
- Head and Shoulders
- Pennant
- Rectangle
- Triangle
- Triple top
- All
- #AAPL
- #AMZN
- #Bitcoin
- #EBAY
- #FB
- #GOOG
- #INTC
- #KO
- #MA
- #MCD
- #MSFT
- #NTDOY
- #PEP
- #TSLA
- #TWTR
- AUDCAD
- AUDCHF
- AUDJPY
- AUDUSD
- EURCAD
- EURCHF
- EURGBP
- EURJPY
- EURNZD
- EURRUB
- EURUSD
- GBPAUD
- GBPCHF
- GBPJPY
- GBPUSD
- GOLD
- NZDCAD
- NZDCHF
- NZDJPY
- NZDUSD
- SILVER
- USDCAD
- USDCHF
- USDJPY
- USDRUB
- All
- M5
- M15
- M30
- H1
- D1
- All
- Buy
- Sale
- All
- 1
- 2
- 3
- 4
- 5

Сформирована фигура «Тройное дно» по торговому инструменту #AMZN на M5. Фигура сигнализирует об изменении тенденции с нисходящей на восходящую в случае пробоя верхней границы 167.17
Таймфреймы М5 и М15 могут иметь больше ложных точек входа.
Открыть график инструмента в новом окне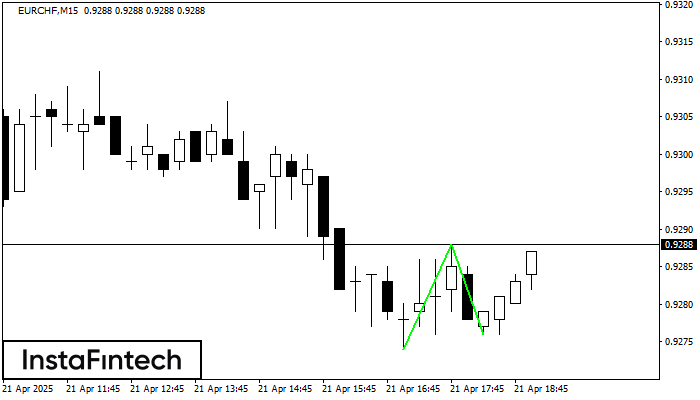
Сформирована фигура «Двойное дно» на графике EURCHF M15. Данное формирование сигнализирует об изменении тенденции с нисходящего на восходящее движение. Сигнал: Торговую позицию на покупку следует открывать после пробоя верхней границы
Таймфреймы М5 и М15 могут иметь больше ложных точек входа.
Открыть график инструмента в новом окне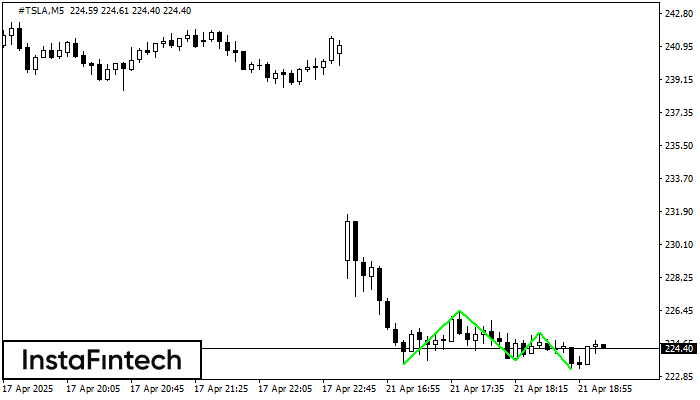
Сформирована фигура «Тройное дно» по торговому инструменту #TSLA на M5. Фигура сигнализирует об изменении тенденции с нисходящей на восходящую в случае пробоя верхней границы 225.24
Таймфреймы М5 и М15 могут иметь больше ложных точек входа.
Открыть график инструмента в новом окне


