signal strength 2 of 5
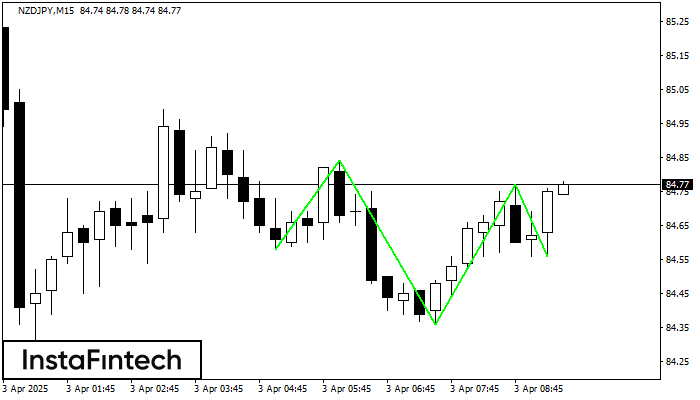
According to the chart of M15, NZDJPY formed the Inverse Head and Shoulder pattern. The Head’s top is set at 84.77 while the median line of the Neck is found at 84.36/84.56. The formation of the Inverse Head and Shoulder pattern evidently signals a reversal of the downward trend. In other words, in case the scenario comes true, the price of NZDJPY will go towards 85.00
The M5 and M15 time frames may have more false entry points.
Juga lihat
- All
- Double Top
- Flag
- Head and Shoulders
- Pennant
- Rectangle
- Triangle
- Triple top
- All
- #AAPL
- #AMZN
- #Bitcoin
- #EBAY
- #FB
- #GOOG
- #INTC
- #KO
- #MA
- #MCD
- #MSFT
- #NTDOY
- #PEP
- #TSLA
- #TWTR
- AUDCAD
- AUDCHF
- AUDJPY
- AUDUSD
- EURCAD
- EURCHF
- EURGBP
- EURJPY
- EURNZD
- EURRUB
- EURUSD
- GBPAUD
- GBPCHF
- GBPJPY
- GBPUSD
- GOLD
- NZDCAD
- NZDCHF
- NZDJPY
- NZDUSD
- SILVER
- USDCAD
- USDCHF
- USDJPY
- USDRUB
- All
- M5
- M15
- M30
- H1
- D1
- All
- Buy
- Sale
- All
- 1
- 2
- 3
- 4
- 5
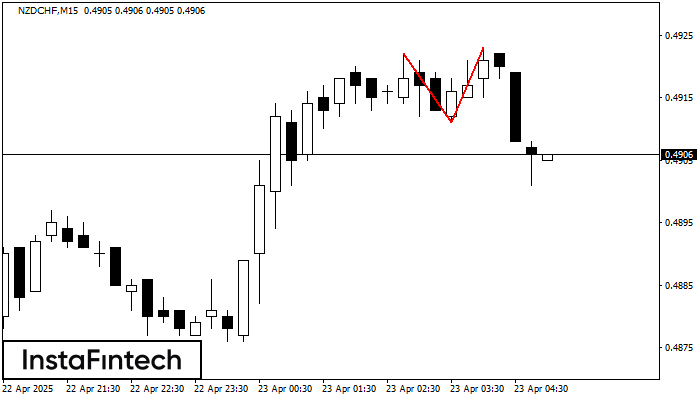
The Double Top pattern has been formed on NZDCHF M15. It signals that the trend has been changed from upwards to downwards. Probably, if the base of the pattern 0.4911
The M5 and M15 time frames may have more false entry points.
Open chart in a new window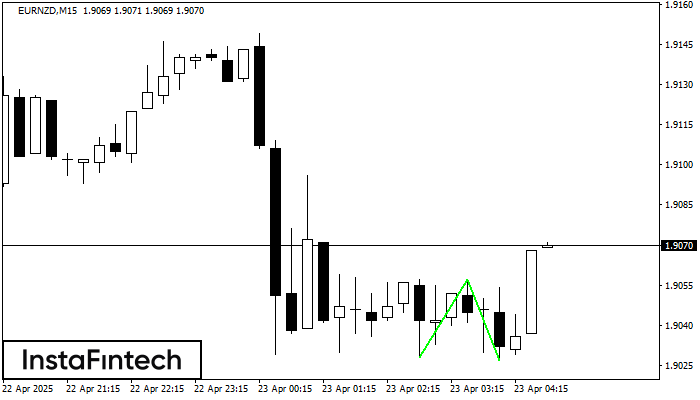
The Double Bottom pattern has been formed on EURNZD M15; the upper boundary is 1.9057; the lower boundary is 1.9027. The width of the pattern is 29 points. In case
The M5 and M15 time frames may have more false entry points.
Open chart in a new window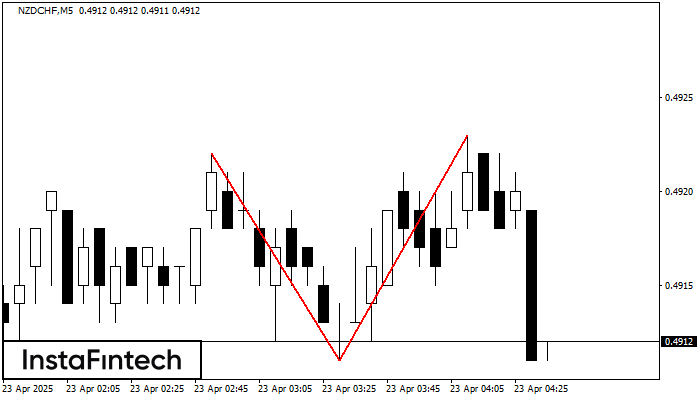
The Double Top reversal pattern has been formed on NZDCHF M5. Characteristics: the upper boundary 0.4922; the lower boundary 0.4911; the width of the pattern is 12 points. Sell trades
The M5 and M15 time frames may have more false entry points.
Open chart in a new window