signal strength 1 of 5
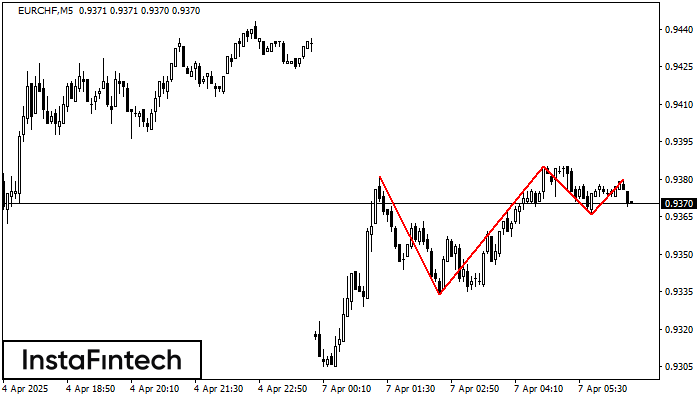
The Triple Top pattern has formed on the chart of the EURCHF M5. Features of the pattern: borders have an ascending angle; the lower line of the pattern has the coordinates 0.9334/0.9366 with the upper limit 0.9381/0.9380; the projection of the width is 47 points. The formation of the Triple Top figure most likely indicates a change in the trend from upward to downward. This means that in the event of a breakdown of the support level of 0.9334, the price is most likely to continue the downward movement.
The M5 and M15 time frames may have more false entry points.
Juga lihat
- All
- Double Top
- Flag
- Head and Shoulders
- Pennant
- Rectangle
- Triangle
- Triple top
- All
- #AAPL
- #AMZN
- #Bitcoin
- #EBAY
- #FB
- #GOOG
- #INTC
- #KO
- #MA
- #MCD
- #MSFT
- #NTDOY
- #PEP
- #TSLA
- #TWTR
- AUDCAD
- AUDCHF
- AUDJPY
- AUDUSD
- EURCAD
- EURCHF
- EURGBP
- EURJPY
- EURNZD
- EURRUB
- EURUSD
- GBPAUD
- GBPCHF
- GBPJPY
- GBPUSD
- GOLD
- NZDCAD
- NZDCHF
- NZDJPY
- NZDUSD
- SILVER
- USDCAD
- USDCHF
- USDJPY
- USDRUB
- All
- M5
- M15
- M30
- H1
- D1
- All
- Buy
- Sale
- All
- 1
- 2
- 3
- 4
- 5

Corak Double Bottom telah dibentuk pada #PEP M5. Pembentukan ini menandakan pembalikan aliran dari aliran menurun ke atas. Isyarat ialah perdagangan membeli harus dibuka selepas sempadan atas corak 140.87 telah
Carta masa M5 dan M15 mungkin mempunyai lebih banyak titik kemasukan palsu.
Open chart in a new window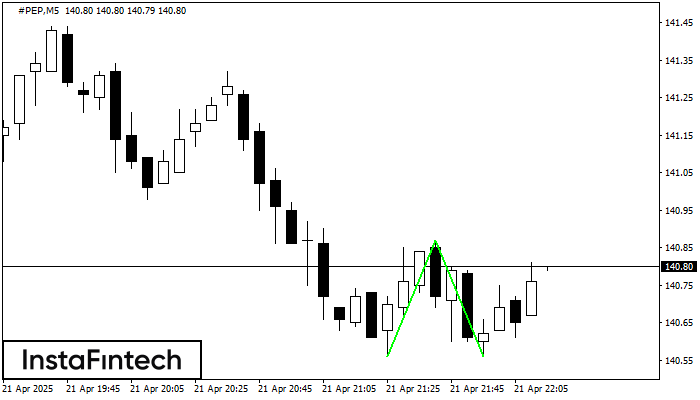
Corak Double Bottom telah dibentuk pada #PEP M5. Ciri-ciri: tahap sokongan 140.56; tahap rintangan 140.87; lebar corak 31 mata. Sekiranya tahap rintangan ditembusi, perubahan aliran boleh diramalkan dengan titik sasaran
Carta masa M5 dan M15 mungkin mempunyai lebih banyak titik kemasukan palsu.
Open chart in a new window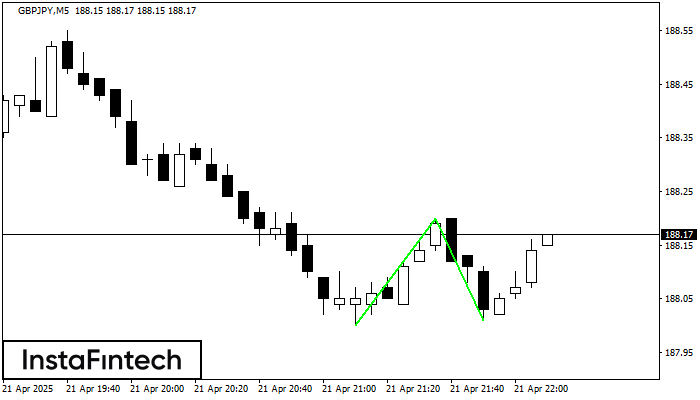
Corak Double Bottom telah dibentuk pada GBPJPY M5. Ciri-ciri: tahap sokongan 188.00; tahap rintangan 188.20; lebar corak 20 mata. Sekiranya tahap rintangan ditembusi, perubahan aliran boleh diramalkan dengan titik sasaran
Carta masa M5 dan M15 mungkin mempunyai lebih banyak titik kemasukan palsu.
Open chart in a new window