signal strength 2 of 5

According to the chart of M15, AUDCAD formed the Bullish Symmetrical Triangle pattern. The lower border of the pattern touches the coordinates 0.8813/0.8844 whereas the upper border goes across 0.8874/0.8844. If the Bullish Symmetrical Triangle pattern is in progress, this evidently signals a further upward trend. In other words, in case the scenario comes true, the price of AUDCAD will breach the upper border to head for 0.8867.
The M5 and M15 time frames may have more false entry points.
- All
- Double Top
- Flag
- Head and Shoulders
- Pennant
- Rectangle
- Triangle
- Triple top
- All
- #AAPL
- #AMZN
- #Bitcoin
- #EBAY
- #FB
- #GOOG
- #INTC
- #KO
- #MA
- #MCD
- #MSFT
- #NTDOY
- #PEP
- #TSLA
- #TWTR
- AUDCAD
- AUDCHF
- AUDJPY
- AUDUSD
- EURCAD
- EURCHF
- EURGBP
- EURJPY
- EURNZD
- EURRUB
- EURUSD
- GBPAUD
- GBPCHF
- GBPJPY
- GBPUSD
- GOLD
- NZDCAD
- NZDCHF
- NZDJPY
- NZDUSD
- SILVER
- USDCAD
- USDCHF
- USDJPY
- USDRUB
- All
- M5
- M15
- M30
- H1
- D1
- All
- Buy
- Sale
- All
- 1
- 2
- 3
- 4
- 5

The Double Bottom pattern has been formed on USDJPY M15; the upper boundary is 141.96; the lower boundary is 141.59. The width of the pattern is 41 points. In case
The M5 and M15 time frames may have more false entry points.
Open chart in a new window
According to the chart of M15, NZDJPY formed the Bullish Symmetrical Triangle pattern. Description: This is the pattern of a trend continuation. 85.15 and 84.50 are the coordinates
The M5 and M15 time frames may have more false entry points.
Open chart in a new window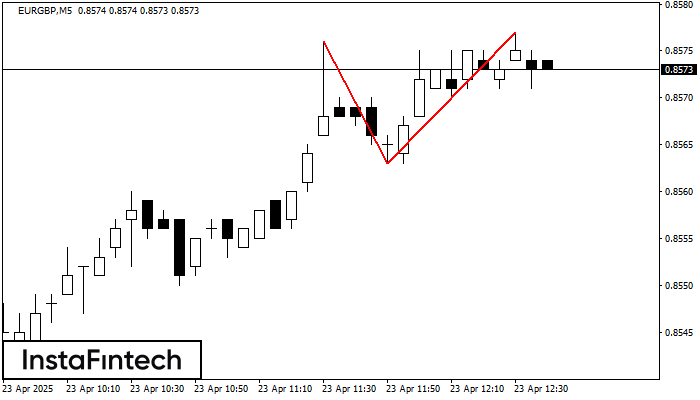
On the chart of EURGBP M5 the Double Top reversal pattern has been formed. Characteristics: the upper boundary 0.8577; the lower boundary 0.8563; the width of the pattern 14 points
The M5 and M15 time frames may have more false entry points.
Open chart in a new window