signal strength 2 of 5
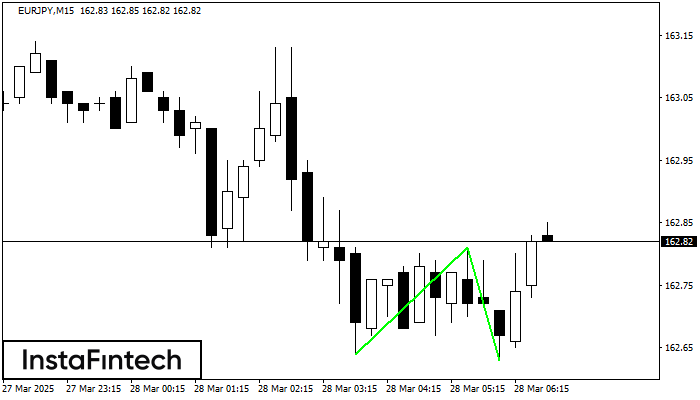
The Double Bottom pattern has been formed on EURJPY M15. This formation signals a reversal of the trend from downwards to upwards. The signal is that a buy trade should be opened after the upper boundary of the pattern 162.81 is broken. The further movements will rely on the width of the current pattern 17 points.
The M5 and M15 time frames may have more false entry points.
See Also
- All
- Double Top
- Flag
- Head and Shoulders
- Pennant
- Rectangle
- Triangle
- Triple top
- All
- #AAPL
- #AMZN
- #Bitcoin
- #EBAY
- #FB
- #GOOG
- #INTC
- #KO
- #MA
- #MCD
- #MSFT
- #NTDOY
- #PEP
- #TSLA
- #TWTR
- AUDCAD
- AUDCHF
- AUDJPY
- AUDUSD
- EURCAD
- EURCHF
- EURGBP
- EURJPY
- EURNZD
- EURRUB
- EURUSD
- GBPAUD
- GBPCHF
- GBPJPY
- GBPUSD
- GOLD
- NZDCAD
- NZDCHF
- NZDJPY
- NZDUSD
- SILVER
- USDCAD
- USDCHF
- USDJPY
- USDRUB
- All
- M5
- M15
- M30
- H1
- D1
- All
- Buy
- Sale
- All
- 1
- 2
- 3
- 4
- 5
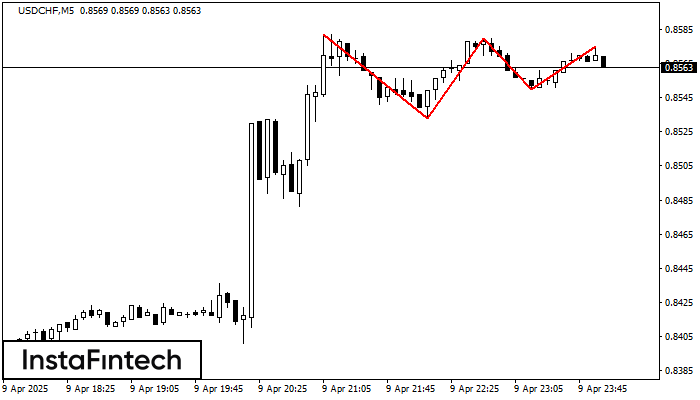
The Triple Top pattern has formed on the chart of the USDCHF M5. Features of the pattern: borders have an ascending angle; the lower line of the pattern
The M5 and M15 time frames may have more false entry points.
Open chart in a new window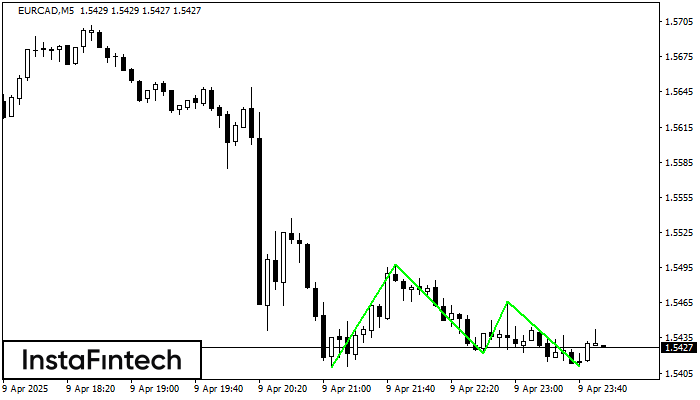
The Triple Bottom pattern has been formed on EURCAD M5. It has the following characteristics: resistance level 1.5498/1.5466; support level 1.5410/1.5411; the width is 88 points. In the event
The M5 and M15 time frames may have more false entry points.
Open chart in a new window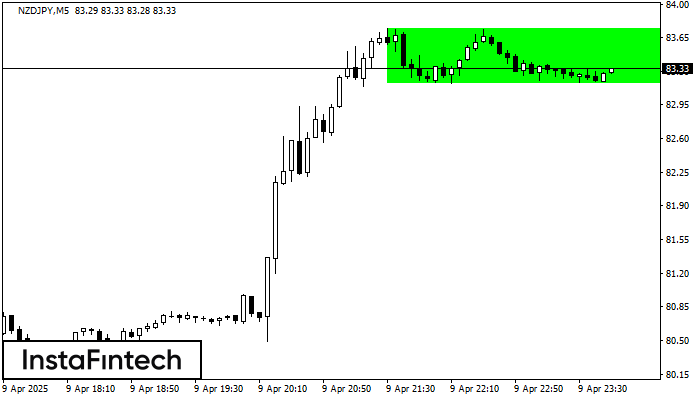
According to the chart of M5, NZDJPY formed the Bullish Rectangle. The pattern indicates a trend continuation. The upper border is 83.75, the lower border is 83.17. The signal means
The M5 and M15 time frames may have more false entry points.
Open chart in a new window