signal strength 1 of 5

According to the chart of M5, USDCHF formed the Bullish Symmetrical Triangle pattern. The lower border of the pattern touches the coordinates 0.8825/0.8830 whereas the upper border goes across 0.8835/0.8830. If the Bullish Symmetrical Triangle pattern is in progress, this evidently signals a further upward trend. In other words, in case the scenario comes true, the price of USDCHF will breach the upper border to head for 0.8845.
The M5 and M15 time frames may have more false entry points.
- All
- Double Top
- Flag
- Head and Shoulders
- Pennant
- Rectangle
- Triangle
- Triple top
- All
- #AAPL
- #AMZN
- #Bitcoin
- #EBAY
- #FB
- #GOOG
- #INTC
- #KO
- #MA
- #MCD
- #MSFT
- #NTDOY
- #PEP
- #TSLA
- #TWTR
- AUDCAD
- AUDCHF
- AUDJPY
- AUDUSD
- EURCAD
- EURCHF
- EURGBP
- EURJPY
- EURNZD
- EURRUB
- EURUSD
- GBPAUD
- GBPCHF
- GBPJPY
- GBPUSD
- GOLD
- NZDCAD
- NZDCHF
- NZDJPY
- NZDUSD
- SILVER
- USDCAD
- USDCHF
- USDJPY
- USDRUB
- All
- M5
- M15
- M30
- H1
- D1
- All
- Buy
- Sale
- All
- 1
- 2
- 3
- 4
- 5

M5 চার্টে, NZDCHF-এর ডাবল টপ রিভার্সাল বা বিপরীতমুখী প্যাটার্ন গঠিত হয়েছে। বৈশিষ্ট্য: উপরের সীমানা 0.4869; নীচের সীমানা 0.4861; প্যাটার্নের প্রস্থ হল 7 পয়েন্ট। 0.4861 0.4846 স্তরের দিকে সম্ভাব্য মুভমেন্টের সাথে
M5 এবং M15 টাইম ফ্রেমে আরও ভুল এন্ট্রি পয়েন্ট থাকতে পারে।
Open chart in a new window
M5 চার্টে SILVER-এর বিয়ারিশ ফ্ল্যাগ প্যাটার্ন গঠিত হয়েছে। অতএব, নিকটতম মেয়াদে নিম্নমুখী প্রবণতা অব্যাহত থাকার সম্ভাবনা রয়েছে। যখনই মূল্য 32.48-এর সর্বনিম্ন স্তরের নীচে ব্রেক করবে, ট্রেডারদের বাজারে প্রবেশ করা উচিত।
M5 এবং M15 টাইম ফ্রেমে আরও ভুল এন্ট্রি পয়েন্ট থাকতে পারে।
Open chart in a new window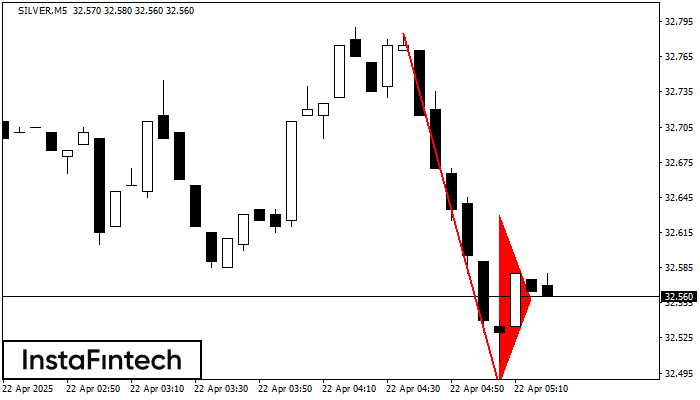
M5 চার্টে SILVER-এর বিয়ারিশ পেন্যান্ট প্যাটার্ন গঠিত হয়েছে৷ এই প্যাটার্নের ধরনটি সামান্য মন্থরতা দ্বারা চিহ্নিত করা হয় যার পরে মূল্য মূল প্রবণতার দিকে চলে যাবে। প্যাটার্নের সর্বনিম্ন 32.48 এর নীচে
M5 এবং M15 টাইম ফ্রেমে আরও ভুল এন্ট্রি পয়েন্ট থাকতে পারে।
Open chart in a new window