EUR/USD
Analysis:
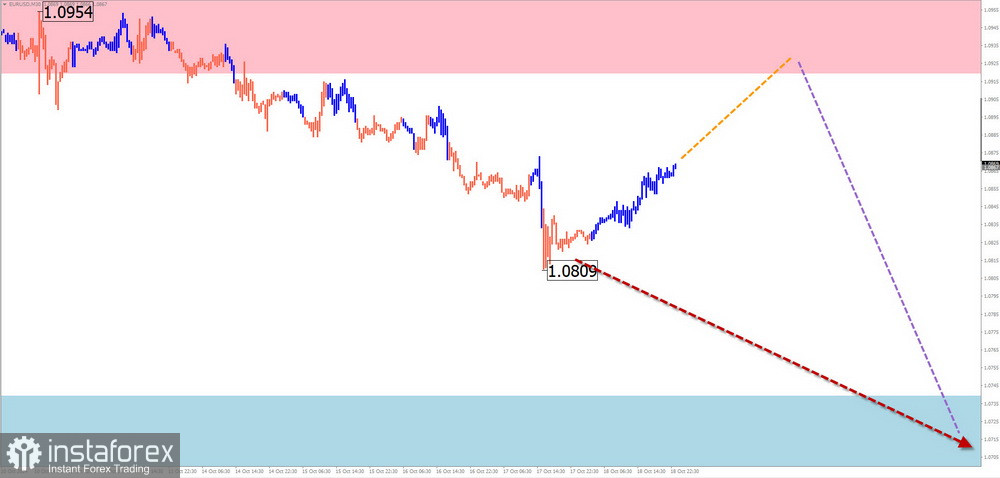
Within the prevailing bullish trend of the euro chart since the end of August, a counter-wave has developed, remaining within the correction of the last segment. At the time of analysis, the wave structure is incomplete, with the final part (C) nearing completion.
Forecast:
During the upcoming week, after a flat phase, a continuation of the euro's downward trend is anticipated. A brief rise may occur in the initial days, possibly pressuring the upper boundary of the resistance zone. A reversal and a continuation of the euro's downtrend are expected afterward.
Potential Reversal Zones
- Resistance: 1.0920/1.0970
- Support: 1.0740/1.0690
Recommendations:
- Sales: Possible after observing corresponding signals near the resistance area on your trading systems.
- Purchases: Have limited potential and carry a high degree of risk.
USD/JPY
Analysis:
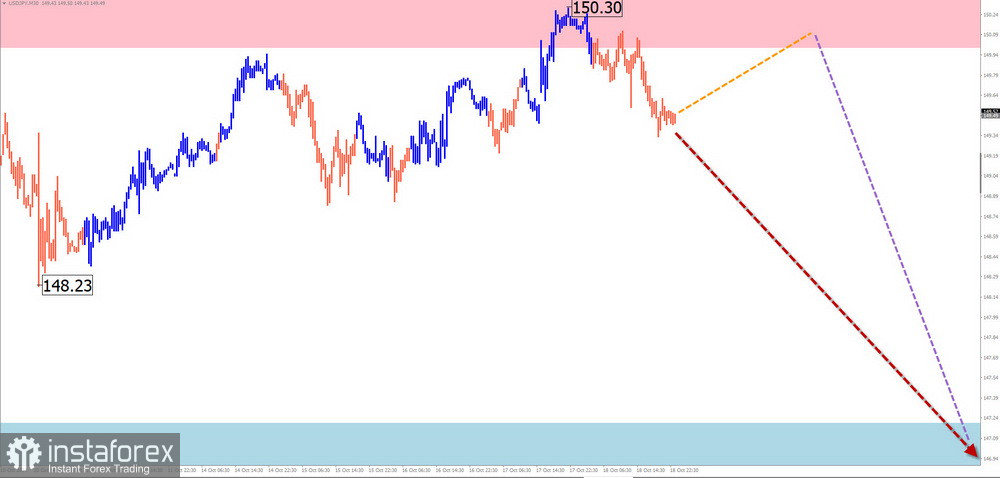
The dominant upward wave of the instrument since August has brought quotes into the area of a strong potential reversal zone on a larger timeframe. The analysis of the wave structure shows the formation of a flat correction starting in early October, which remains incomplete at the time of analysis. Without a complete correction, further upward movement is unlikely.
Forecast:
The beginning of the upcoming week is expected to remain in a sideways range, with price movements along the resistance zone. Pressure on this zone is possible, with a slight move beyond its upper boundary. In the second half of the week, a trend shift, increased volatility, and the start of a price decline are anticipated.
Potential Reversal Zones
- Resistance: 150.00/150.50
- Support: 147.20/146.70
Recommendations:
- Sales: Become relevant after confirmed reversal signals appear near the resistance zone.
- Purchases: There are no conditions for such trades in the market at this time.
GBP/JPY
Analysis:
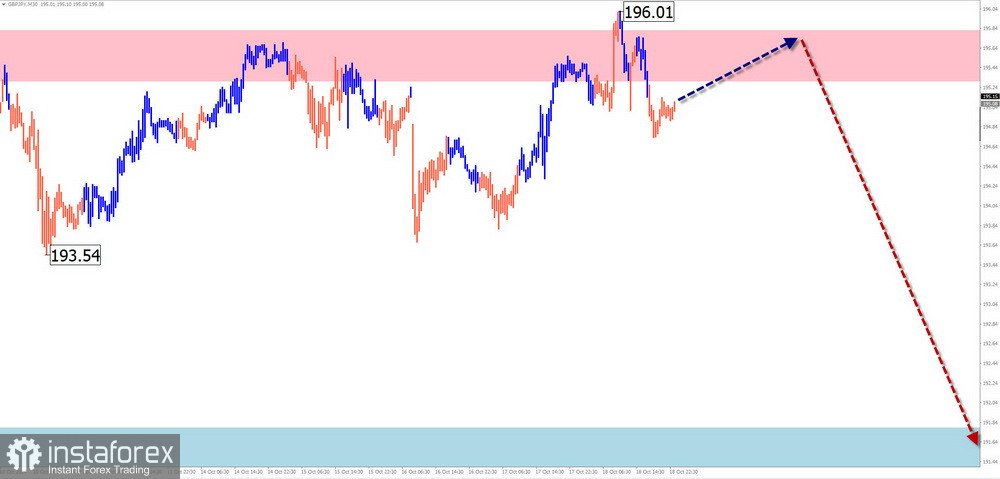
The incomplete segment of the dominant uptrend for the GBP/JPY pair has been developing since September 11. The price has reached the lower boundary of a strong potential reversal zone on a larger scale. An intermediate correction in the form of a sliding flat has been developing over the past 3 weeks within the last part of the wave.
Forecast:
In the upcoming week, continued movement between the nearest counter-directional zones is expected. Pressure on the resistance zone may occur in the initial days. A trend reversal and a downward movement are likely afterward, with a decline anticipated to the support boundaries. A return to a bullish course is possible as early as next week.
Potential Reversal Zones
- Resistance: 195.30/195.80
- Support: 191.80/191.30
Recommendations:
- Purchases: Permissible but should be limited to reduced volume sizes in intraday trades.
- Sales: Will be relevant after confirmed reversal signals appear near the resistance area on your trading systems.
USD/CAD
Analysis:
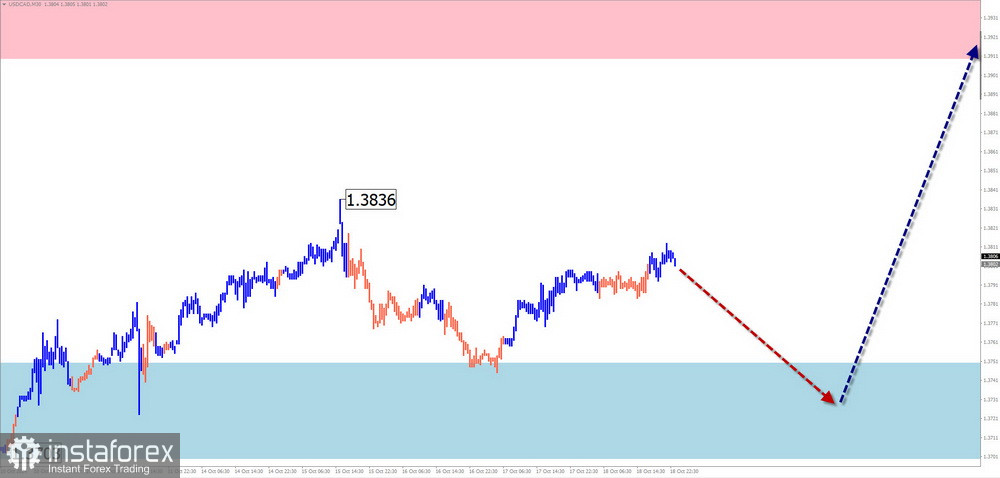
Since the end of September this year, the short-term price action of the Canadian dollar has been driven by an uptrend. Quotes have broken through a resistance level on a higher timeframe, turning it into support. Over the past week, prices have been forming a segment of correction, which remains incomplete. The price is mainly moving within a horizontal range.
Forecast:
At the beginning of the upcoming week, the overall sideways movement is expected to continue along the support level. A course change and a resumption of the upward price direction are expected afterward. The price rise could extend up to the boundaries of the calculated resistance.
Potential Reversal Zones
- Resistance: 1.3910/1.3960
- Support: 1.3750/1.3700
Recommendations:
- Purchases: Will become relevant after observing reversal signals near the support zone on your trading systems.
- Sales: May be risky with limited potential.
NZD/USD
Brief Analysis:
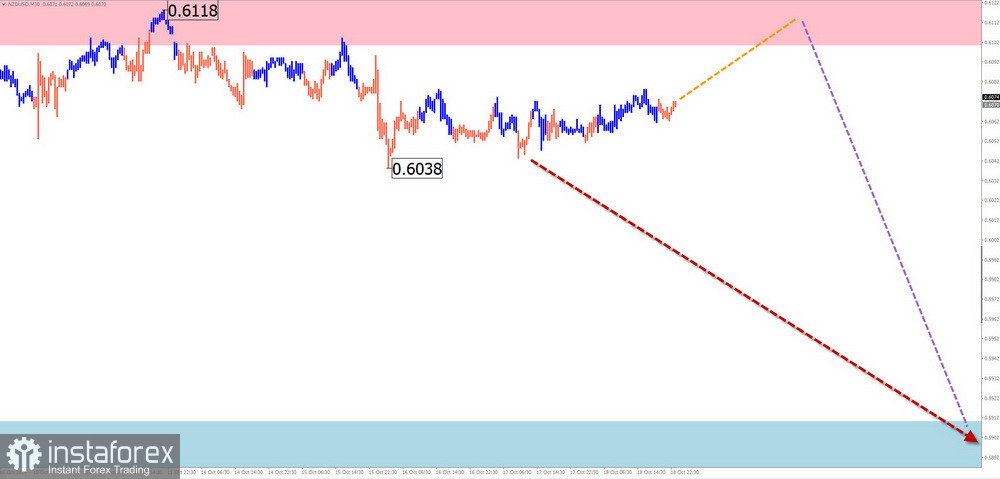
Since December of last year, the downward wave on the daily timeframe for the New Zealand dollar has been moving the price mostly sideways. The incomplete segment of the trend started on September 30. After breaking strong support, the past two weeks have seen the formation of an intermediate horizontal correction (B), which is still incomplete.
Weekly Forecast:
At the beginning of the upcoming week, the New Zealand dollar is expected to continue its overall sideways course. Pressure on the resistance zone is possible. A trend change is likely in the later part of the week, with the price expected to decline to the support boundaries.
Potential Reversal Zones
- Resistance: 0.6100/0.6150
- Support: 0.5910/0.5860
Recommendations:
- Sales: Become relevant after observing reversal signals near the support zone.
- Purchases: May be unprofitable and are not recommended.
Gold
Analysis:
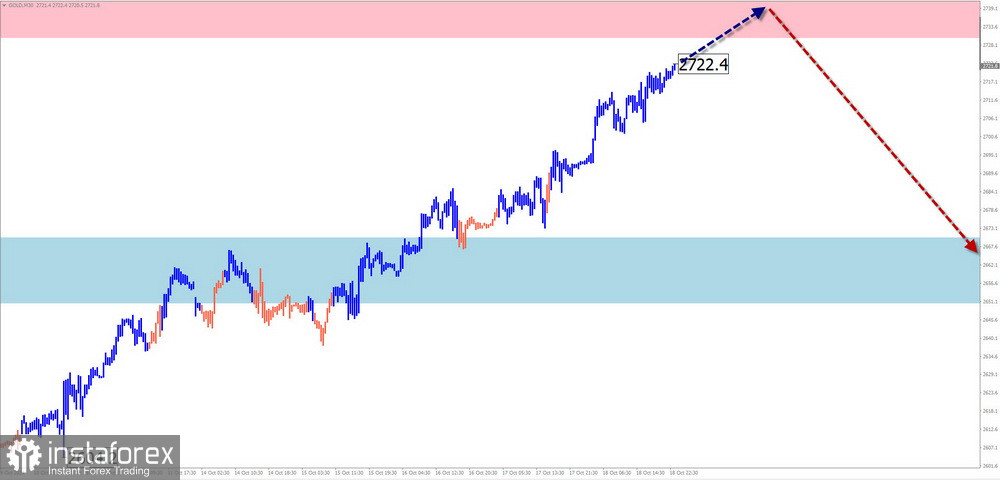
The price trend of gold over the past two years has been driven by an upward wave. On October 8, an incomplete segment of the main trend began moving upward. The price of the instrument is approaching the upper boundary of a broad potential reversal zone on a weekly scale chart.
Forecast:
The upward price movement that began last week should continue in the upcoming week. The most likely area for the rise to end is the calculated resistance. Afterward, a reversal and the start of a downward pullback can be expected.
Potential Reversal Zones
- Resistance: 2730.0/2750.0
- Support: 2670.0/2650.0
Recommendations:
- Purchases: Have limited potential and may be risky.
- Sales: Premature until confirmed reversal signals appear on your trading systems.
Explanations: In simplified wave analysis (SWA), all waves consist of three parts (A-B-C). The analysis focuses on the last unfinished wave on each timeframe. Dashed lines indicate expected movements.
Note: The wave algorithm does not consider the duration of price movements over time!
This version addresses the identified issues and ensures the translation is clearer and more suitable for a financial context. Let me know if any further adjustments are needed!