signal strength 2 of 5
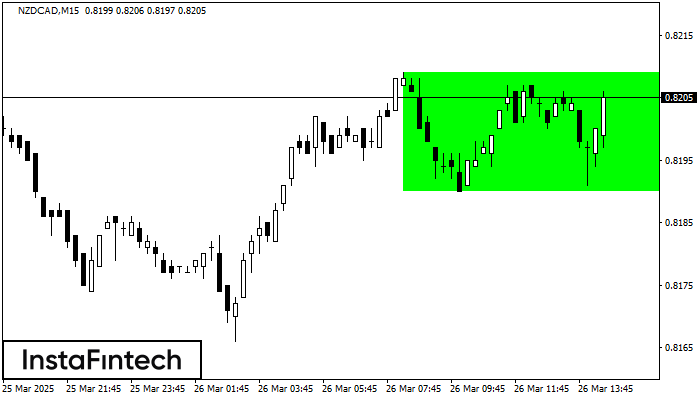
According to the chart of M15, NZDCAD formed the Bullish Rectangle which is a pattern of a trend continuation. The pattern is contained within the following borders: the lower border 0.8190 – 0.8190 and upper border 0.8209 – 0.8209. In case the upper border is broken, the instrument is likely to follow the upward trend.
The M5 and M15 time frames may have more false entry points.
Veja também
- All
- Double Top
- Flag
- Head and Shoulders
- Pennant
- Rectangle
- Triangle
- Triple top
- All
- #AAPL
- #AMZN
- #Bitcoin
- #EBAY
- #FB
- #GOOG
- #INTC
- #KO
- #MA
- #MCD
- #MSFT
- #NTDOY
- #PEP
- #TSLA
- #TWTR
- AUDCAD
- AUDCHF
- AUDJPY
- AUDUSD
- EURCAD
- EURCHF
- EURGBP
- EURJPY
- EURNZD
- EURRUB
- EURUSD
- GBPAUD
- GBPCHF
- GBPJPY
- GBPUSD
- GOLD
- NZDCAD
- NZDCHF
- NZDJPY
- NZDUSD
- SILVER
- USDCAD
- USDCHF
- USDJPY
- USDRUB
- All
- M5
- M15
- M30
- H1
- D1
- All
- Buy
- Sale
- All
- 1
- 2
- 3
- 4
- 5

O padrão Fundo duplo foi formado em NZDCAD M30. Características: o nível de suporte 0.8188; o nível de resistência 0.8232; a largura do padrão 44 pontos. Se o nível
Open chart in a new window
O padrão Bandeira de Alta foi formado em NZDCHF a M5. O limite inferior do padrão está localizado em 0.4839/0.4829, enquanto o limite superior está em 0.4849/0.4839. A projeção
Os intervalos M5 e M15 podem ter mais pontos de entrada falsos.
Open chart in a new window
O sinal de Pennant de alta – Instrumento de negociação NZDCHF M5, padrão de continuação. Previsão: é possível definir uma posição de compra acima da altura do padrão de 0.4849
Os intervalos M5 e M15 podem ter mais pontos de entrada falsos.
Open chart in a new window