


signal strength 1 of 5
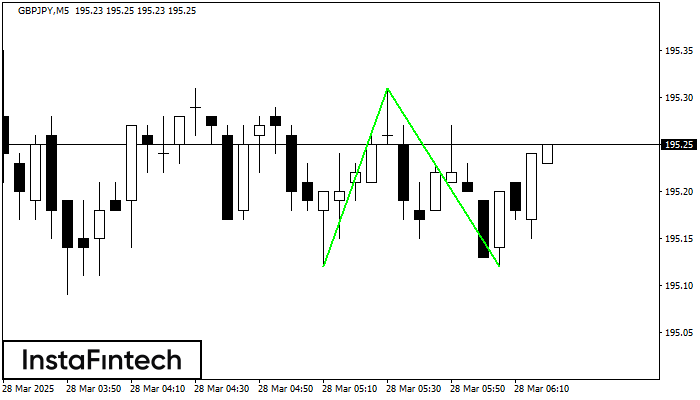
The Double Bottom pattern has been formed on GBPJPY M5. This formation signals a reversal of the trend from downwards to upwards. The signal is that a buy trade should be opened after the upper boundary of the pattern 195.31 is broken. The further movements will rely on the width of the current pattern 19 points.
The M5 and M15 time frames may have more false entry points.
Veja também
- All
- Double Top
- Flag
- Head and Shoulders
- Pennant
- Rectangle
- Triangle
- Triple top
- All
- #AAPL
- #AMZN
- #Bitcoin
- #EBAY
- #FB
- #GOOG
- #INTC
- #KO
- #MA
- #MCD
- #MSFT
- #NTDOY
- #PEP
- #TSLA
- #TWTR
- AUDCAD
- AUDCHF
- AUDJPY
- AUDUSD
- EURCAD
- EURCHF
- EURGBP
- EURJPY
- EURNZD
- EURRUB
- EURUSD
- GBPAUD
- GBPCHF
- GBPJPY
- GBPUSD
- GOLD
- NZDCAD
- NZDCHF
- NZDJPY
- NZDUSD
- SILVER
- USDCAD
- USDCHF
- USDJPY
- USDRUB
- All
- M5
- M15
- M30
- H1
- D1
- All
- Buy
- Sale
- All
- 1
- 2
- 3
- 4
- 5
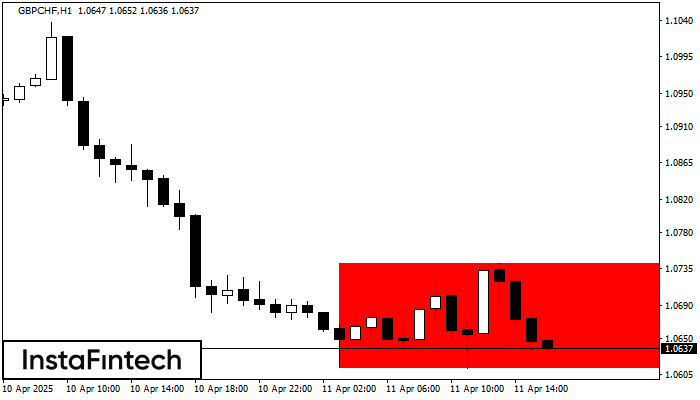
De acordo com o gráfico de H1, GBPCHF formou Retângulo de baixa. O padrão indica uma continuação da tendência. O limite superior é 1.0742, o limite inferior é 1.0613
Open chart in a new window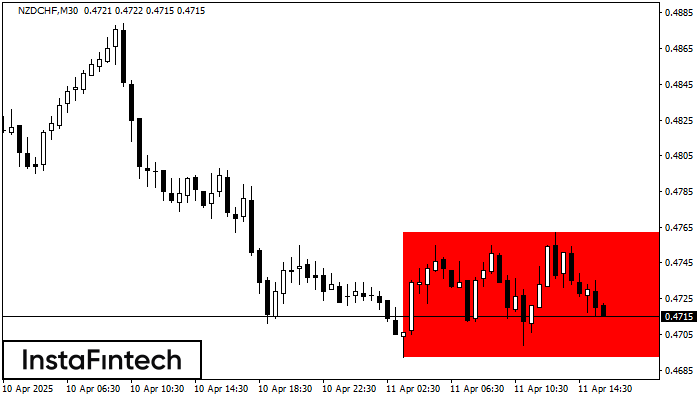
De acordo com o gráfico de M30, NZDCHF formou Retângulo de baixa. O padrão indica uma continuação da tendência. O limite superior é 0.4762, o limite inferior é 0.4692
Open chart in a new window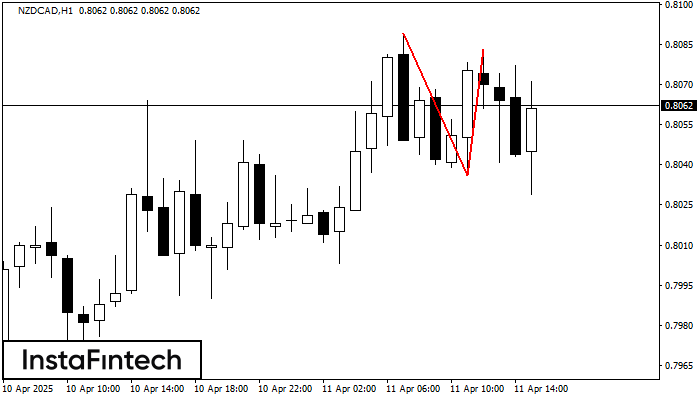
No gráfico de NZDCAD H1 o padrão de reversão Topo duplo foi formado. Características: o limite superior 0.8083; o limite inferior 0.8036; a largura do padrão 47 pontos. O sinal
Open chart in a new window


