empty
сформирован 28.03 в 21:01:08 (UTC+0)
сила сигнала 2 из 5
Тройное дно #NTDOY M15

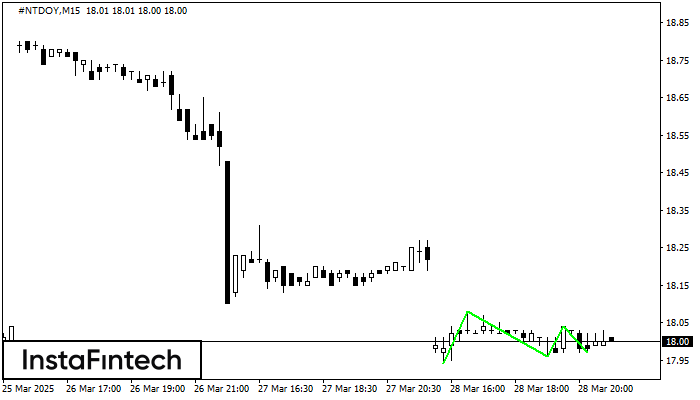
По торговому инструменту #NTDOY на M15 была сформирована графическая фигура «Тройное дно» с характеристиками: Уровень сопротивления 18.04; Уровень поддержки 17.97; Ширина 7 пунктов. В случае пробоя уровня сопротивления 18.08 котировка, скорее всего, продолжит восходящее движение как минимум на 12 пунктов.

Таймфреймы М5 и М15 могут иметь больше ложных точек входа.

Фигура
  • Все
  • Вымпел
  • Голова и плечи
  • Двойная вершина
  • Прямоугольник
  • Треугольник
  • Тройная вершина
  • Флаг
Инструмент
  • Все
  • #AAPL
  • #AMZN
  • #Bitcoin
  • #EBAY
  • #FB
  • #GOOG
  • #INTC
  • #KO
  • #MA
  • #MCD
  • #MSFT
  • #NTDOY
  • #PEP
  • #TSLA
  • #TWTR
  • AUDCAD
  • AUDCHF
  • AUDJPY
  • AUDUSD
  • EURCAD
  • EURCHF
  • EURGBP
  • EURJPY
  • EURNZD
  • EURRUB
  • EURUSD
  • GBPAUD
  • GBPCHF
  • GBPJPY
  • GBPUSD
  • GOLD
  • NZDCAD
  • NZDCHF
  • NZDJPY
  • NZDUSD
  • SILVER
  • USDCAD
  • USDCHF
  • USDJPY
  • USDRUB
Таймфрейм
  • Все
  • M5
  • M15
  • M30
  • H1
  • D1
Тренд
  • Все
  • Покупка
  • Продажа
Сила сигнала
  • Все
  • 1
  • 2
  • 3
  • 4
  • 5
Double Top
сформирован 30.04 в 23:00:21 (UTC+0)
сила сигнала 5 из 5
Double Top NZDCAD D1

On the chart of NZDCAD D1 the Double Top reversal pattern has been formed. Characteristics: the upper boundary 0.8316; the lower boundary 0.7826; the width of the pattern 490 points

Открыть график инструмента в новом окне
Triple Bottom
сформирован 30.04 в 22:40:20 (UTC+0)
сила сигнала 1 из 5
Triple Bottom NZDCAD M5

The Triple Bottom pattern has been formed on NZDCAD M5. It has the following characteristics: resistance level 0.8188/0.8185; support level 0.8180/0.8179; the width is 8 points. In the event

The M5 and M15 time frames may have more false entry points.

Открыть график инструмента в новом окне
Bullish Symmetrical Triangle
сформирован 30.04 в 21:56:12 (UTC+0)
сила сигнала 2 из 5
Bullish Symmetrical Triangle #Bitcoin M15

According to the chart of M15, #Bitcoin formed the Bullish Symmetrical Triangle pattern. The lower border of the pattern touches the coordinates 92482.78/94081.93 whereas the upper border goes across 95186.64/94081.93

The M5 and M15 time frames may have more false entry points.

Открыть график инструмента в новом окне
Hozir telefon orqali gaplasha olmaysizmi?
Savolingizni bering chatda.
Обратный звонок
 

Dear visitor,

Your IP address shows that you are currently located in the USA. If you are a resident of the United States, you are prohibited from using the services of InstaFintech Group including online trading, online transfers, deposit/withdrawal of funds, etc.

If you think you are seeing this message by mistake and your location is not the US, kindly proceed to the website. Otherwise, you must leave the website in order to comply with government restrictions.

Why does your IP address show your location as the USA?

  • - you are using a VPN provided by a hosting company based in the United States;
  • - your IP does not have proper WHOIS records;
  • - an error occurred in the WHOIS geolocation database.

Please confirm whether you are a US resident or not by clicking the relevant button below. If you choose the wrong option, being a US resident, you will not be able to open an account with InstaForex anyway.

We are sorry for any inconvenience caused by this message.