signal strength 3 of 5
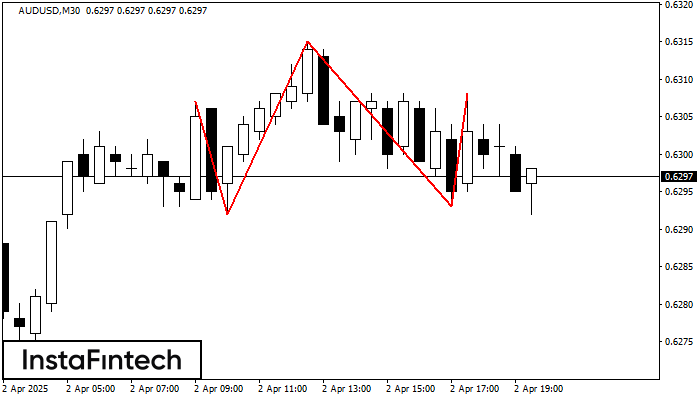
The AUDUSD M30 formed the Head and Shoulders pattern with the following features: The Head’s top is at 0.6315, the Neckline and the upward angle are at 0.6292/0.6293. The formation of this pattern can bring about changes in the current trend from bullish to bearish. In case the pattern triggers the expected changes, the price of AUDUSD will go towards 0.6263.
Xem thêm
- All
- Double Top
- Flag
- Head and Shoulders
- Pennant
- Rectangle
- Triangle
- Triple top
- All
- #AAPL
- #AMZN
- #Bitcoin
- #EBAY
- #FB
- #GOOG
- #INTC
- #KO
- #MA
- #MCD
- #MSFT
- #NTDOY
- #PEP
- #TSLA
- #TWTR
- AUDCAD
- AUDCHF
- AUDJPY
- AUDUSD
- EURCAD
- EURCHF
- EURGBP
- EURJPY
- EURNZD
- EURRUB
- EURUSD
- GBPAUD
- GBPCHF
- GBPJPY
- GBPUSD
- GOLD
- NZDCAD
- NZDCHF
- NZDJPY
- NZDUSD
- SILVER
- USDCAD
- USDCHF
- USDJPY
- USDRUB
- All
- M5
- M15
- M30
- H1
- D1
- All
- Buy
- Sale
- All
- 1
- 2
- 3
- 4
- 5
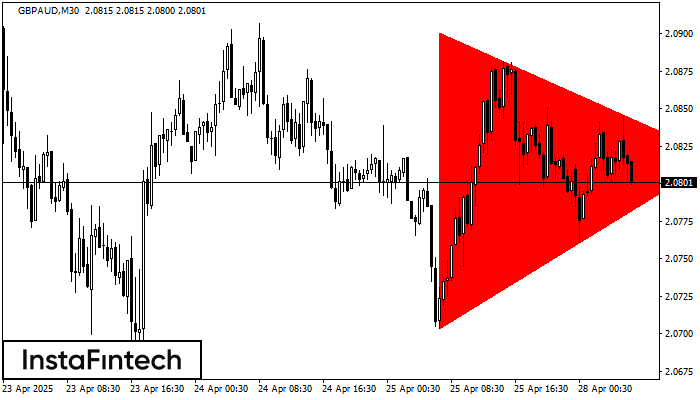
De acordo com o gráfico de M30, GBPAUD formou o padrão Triângulo Simétrico de Baixa. Descrição: o limite inferior é 2.0704/2.0818 e o limite superior é 2.0901/2.0818. A largura
Open chart in a new window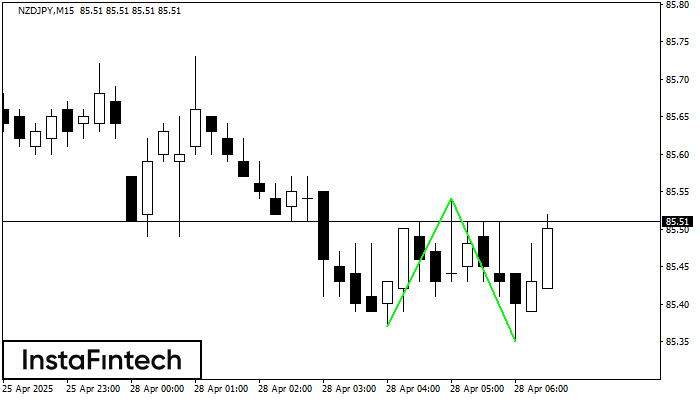
O padrão Fundo duplo foi formado em NZDJPY M15; o limite superior é 85.54; o limite inferior é 85.35. A largura do padrão é de 17 pontos. No caso
Os intervalos M5 e M15 podem ter mais pontos de entrada falsos.
Open chart in a new window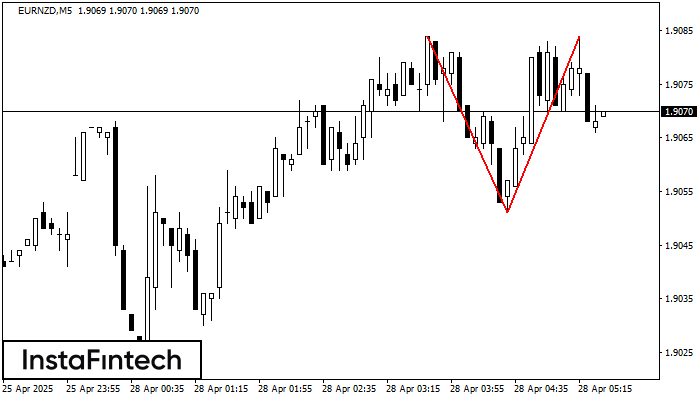
No gráfico de EURNZD M5 o padrão de reversão Topo duplo foi formado. Características: o limite superior 1.9084; o limite inferior 1.9051; a largura do padrão 33 pontos. O sinal
Os intervalos M5 e M15 podem ter mais pontos de entrada falsos.
Open chart in a new window